Production tool |
Peer reviewed |
A decision-making framework for evaluating interventions used at weaning to reduce mortality in lightweight pigs and improve weight gains in the nursery
Un modelo de toma de decisiones para evaluar diferentes intervenciones utilizadas en el destete para reducir la mortalidad en cerdos de bajo peso y para mejorar la ganancia de peso en el destete
Une structure de la prise de décision pour évaluer des interventions qui ont été utilisées à sevrage pour réduire la mortalité dans les cochons de poids léger et pour améliorer le gain du poids dans la croissance
A. J. Larriestra, DVM, MSc, PhD; R. B. Morrison, DVM, MBA, PhD; J. Deen, DVM, MSc, PhD, Diplomate ABVP
College of Veterinary Medicine, Department of Clinical and Population Sciences, University of Minnesota, St Paul, MN 55108; Corresponding author: Dr A. J. Larriestra, Departamento de Patología Animal, Facultad de Agronomía y Veterinaria, Universidad Nacional de Rio Cuarto, Enlace ruta 8 y 36, Rio Cuarto, 5800, Córdoba, Argentina; Tel: 54 358 4676213; Fax: 54 358 4680280; E-mail: alarriestra@ayv.unrc.edu.ar
Cite as: Larriestra AJ, Morrison RB, Deen J. A decision-making framework for evaluating interventions used at weaning to reduce mortality in lightweight pigs and improve weight gains in the nursery. J Swine Health Prod. 2005;13(3):143-149.
Also available as a PDF.
SummaryA decision model to aid in selecting treatments for weaned pigs was developed and tested, with the purpose of reducing nursery mortality and improving weight gain. Interventions evaluated were to not treat pigs, to treat the whole population, or to treat only a subgroup of pigs below a certain weaning weight (target treatment). Outcome was characterized as death or survival. Losses were set at zero for survivors weighing > 14.5 kg at the end of the nursery phase. Survivors weighing <= 14.5 were defined as lightweight pigs (LWP). Losses due to LWP and death were modeled as 30% and 60%, respectively, of the feeder pig market price (1974 to 2002 average, United States Department of Agriculture). Treatment effect, mortality, proportion of LWP, and treatment cost were subjected to sensitivity analysis. Losses were minimal for mortality < 7% and LWP < 18% when target treatment was used with different weaning weight cutoffs. Treating the whole population was economically efficient (mortality and LWP were at least 40% lower) if performance was poor. Each course of action evaluated may minimize losses. However, target treatment minimizes losses for a wide range of mortality, proportion of LWP, and treatment-cost situations. | ResumenUn modelo de decisión para ayudar a decidir el tratamiento para cerdos destetados fue desarrollado y probado con el propósito de reducir la mortalidad en el destete para mejorar la ganancia de peso. Las intervenciones evaluadas fueron: no dar tratamiento a los cerdos, dar tratamiento a la población completa o dar tratamiento sólo a un subgrupo de cerdos por abajo de un cierto peso en el destete (tratamiento táctico). El resultado se determinó como muerte o supervivencia. Las pérdidas se establecieron en cero para los sobrevivientes con peso > 14.5 Kg. al final de la fase de destete. Los supervivientes con peso <= 14.5 se definieron como cerdos de bajo peso (LWP por sus siglas en inglés). Las pérdidas debidas a LWP y la mortalidad se manejaron como el 30% y 60%, respectivamente, del precio de mercado de cerdos para engorda (promedio de 1974 a 2002, Departamento de Agricultura de los Estados Unidos). El efecto del tratamiento, la mortalidad, la proporción de LWP y el costo del tratamiento fueron sujetos a un análisis de sensibilidad. Las pérdidas fueron mínimas para la mortalidad < al 7% y la de LWP < al 18%, cuando el tratamiento táctico se utilizó con diferentes pesos límite en el destete. El tratamiento de la población completa fue económicamente eficiente (mortalidad y LWP fueron, por lo menos, 40% menores) si el desempeño era malo. Cada tratamiento evaluado puede minimizar las pérdidas. Sin embargo, el tratamiento táctico minimiza las pérdidas para un amplio rango de mortalidad, proporción de LWP, y situaciones de tratamiento-costo. | ResuméUn modèle de décision pour aider sélectionner le traitement dans la pouponnière a été développé et testé avec le but de réduire la mortalité et améliorer le gain du poids. Des interventions qu'ont été évaluées ont été ne traiter pas de cochons, traiter la population entière, ou traiter seulement un sous-groupe de cochons au-dessous d'un certain poids du sevrage (Intervention tactique). Le résultat a été caractérisé comme mort ou survie. Les pertes ont été mises à zéro pour survivants qui pèsent > de 14.5 kg à la fin de la phase de la croissance. Les survivants qui pèsent <= 14.5 kg ont été définis comme cochons de poids léger (LWP par ses initiales en anglais). Les pertes dû à LWP et à la mort ont été modelés comme 30% et 60%, respectivement, du prix du marché du cochon pour engraissement (Département d'Agriculture des États-Unis, la moyenne de 1974 a 2004). L'effet du traitement, la mortalité, la proportion de LWP, et le coût du traitement ont été soumis à l'analyse de sensibilité. Les pertes ont été minimes pour la mortalité < 7% et LWP < 18% quand le traitement tactique a été utilisé avec des limites différents du poids du sevrage.Traiter la population entière a été économiquement effectif (la mortalité et LWP inférieure a 40%) si la performance était pauvre. Chaque cours d'action qui a été évalué a la possibilité de minimiser des pertes. Cependant, le traitement tactique minimise des pertes pour une grande gamme de mortalité, proportion de LWP, et situations du traitement coût. |
Keywords: swine, decision
analysis, lightweight pigs, nursery mortality, weight gain
Search the AASV web site
for pages with similar keywords.
Received: September
10, 2003
Accepted: March
1, 2004
In order to promote health and good performance in the nursery, managers try to improve the condition of weaned pigs (eg, immune status or weaning weight) and to develop strategies focusing on pigs that may not perform well during the nursery phase. If resources are scarce (for example, labor to examine or treat all pigs entering the nursery), interventions applied to the whole population may not always be financially efficient, because the cost of the measures may outweigh the benefits.1 Therefore, limiting treatment to subgroups of pigs at higher risk of dying or failing to grow satisfactorily is a strategy that should be examined in detail.
Low weaning weight is a risk indicator for poor growth performance and death in pigs during the nursery phase.2-4 It is also a commonly used criterion for sorting weaned pigs. Hence, low weaning weight may be a good criterion for identifying and targeting the subgroup of a cohort that is expected to have lower ending nursery weight and poor survival compared to heavier weaned pigs. Herd data on the relationship between weaning weight and mortality or low ending nursery weight may help to devise interventions for targeting weaned pigs with greater potential for poor performance, and may constitute the basis for developing an ad hoc decision-making framework for financial evaluation of management decisions.
Decision analysis is an appropriate tool for evaluating interventions that target individuals animals, for example, treatment assignments.5 This technique has been widely used in veterinary medicine and swine production,6-9 because it can help to outline the most critical financial and technical aspects of the decision process. Examples of decision-tree applications are evaluation of benefits of vaccination against reproductive failure induced by swine parvovirus,7 evaluation of pregnancy detection systems using ultrasound compared to heat checking of bred sows using a boar 3 weeks after breeding,8 and assessment of the cost associated with misclassification when diagnostic tests are applied.10
Decision analysis is suitable when interventions face uncertainty (eg, the lack of precise figures for a decision parameter such as treatment effect) and a meaningful trade-off, in terms of costs and benefits, exists among competing courses of action.6,7 When the model is built, quantitative information is necessary to estimate probabilities, costs, and benefits.11 Herd data are more valuable than data from published reports. The more quantitative information available, the lower will be the uncertainty in the decision. However, no matter how good the data are, a sensitivity analysis must be performed to test the way changes in the probabilities, costs, and benefits influence the decision prescribed by the model.11 Sensitivity analysis is also required to test the performance of the tree against common sense and prior beliefs.12
The purpose of this study was to develop and test a decision model that could be used as a management tool to aid in the treatment of weaned pigs in order to reduce mortality and improve weight gain in the nursery phase.
Materials and methods
Decision process and interventions
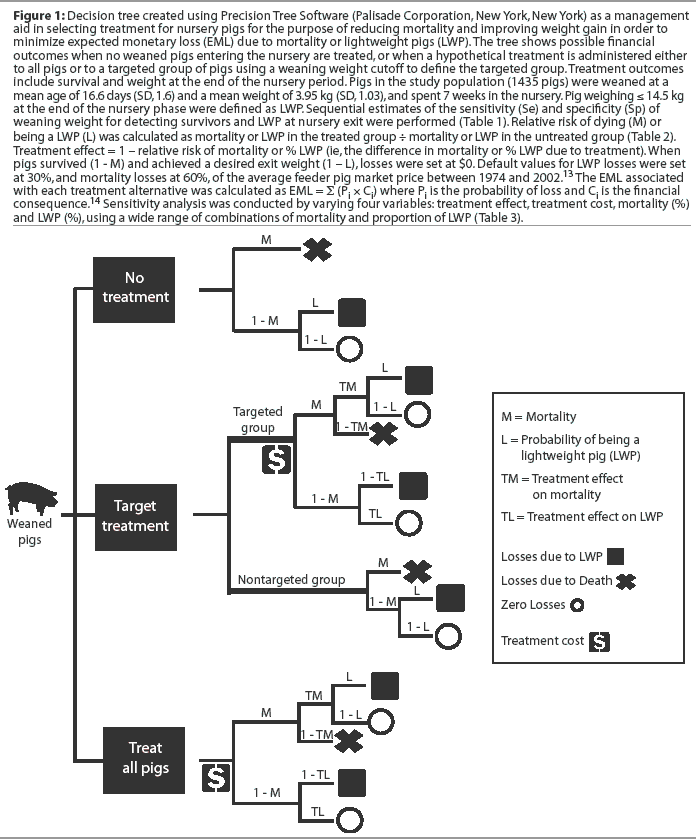
The nursery outcome was characterized as death or survival, and within survivors, pigs were classified as lightweight (weighing <= 14.5 kg) or heavyweight pigs at exit (Figure 1). The decision to treat weaned pigs is made in the nursery facility, where, upon arrival, an antibiotic may be administered to reduce nursery mortality and the proportion of lightweight pigs (LWP) at end of the nursery phase. Three alternatives were considered: do not treat pigs (Option One); treat the whole population (Option Two); or treat a subgroup of pigs (targeted group; Option Three), including only pigs under a certain weaning weight (weight cutoff). The treatment modeled was a hypothetical example.
Decision tree data sources, probabilities, and trade-offs
Data concerning the relationship between weaning weight and survival and the pig's weight at the end of nursery phase are reported findings from a study conducted during 2002 in a nursery facility in Iowa.15 Data extracted from the pig cohort evaluated in that study (n= 1435) were classified in binary categories of weaning weights, ie, weight <= the cutoff (kg) or weight > the cutoff, in order to perform a sequential estimation of the sensitivity and specificity of weaning weight for detecting survivors and LWP at nursery exit (Table 1). The outcomes included survival (among the 1435 original pigs) and weight at the end of the nursery period (among the 1330 surviving pigs). Pigs that weighed <= 14.5 kg at week 10 after birth were defined as LWP, a criterion which included pigs in the lowest third of the weight distribution at the end of the nursery phase in the population studied.15
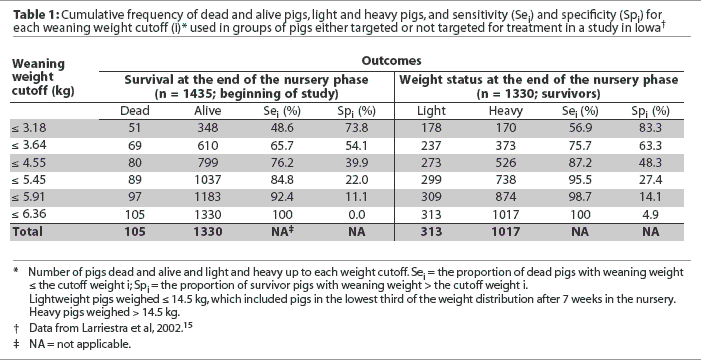
Sensitivity (Sei) was defined as the proportion of dead or LWP with weaning weight less than or equal to the cutoff (i). For instance, when pigs were stratified using a 3.18-kg cutoff, the sensitivity of detecting dead pigs was Se <= 3.18 = 48.6% [(51 105) x 100] (Table 1). Specificity (Spi) was defined as the proportion of survivor or heavyweight pigs with weaning weight greater than the cutoff. The Spi using a 3.18-kg cutoff was Sp > 3.18 = 73.8% [(1-(348 1330) x 100] (Table 1).
Sensitivity increased as weaning weight cutoff increased, because more cases (dead or LWP) were captured in the target group. Conversely, specificity decreased as weaning weight cutoff increased, because more survivors and heavy weight pigs were captured in the target group.
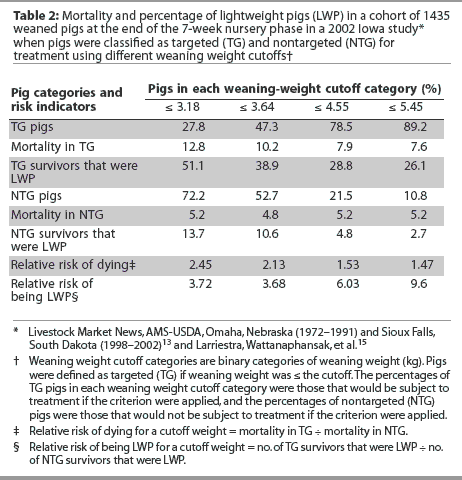
The Sei and Spi estimates were used to calculate the conditional probability of dying or being an LWP for each weaning weight cutoff, which was calculated as follows: P(dying or being LWP weaning weight cutoff i) = (Pr x Sei) [(Pr x Sei) + (1 - Pr) x (1 - Spi)],10 where Pr is the proportion of dead pigs (mortality) or the proportion of LWP at the end of the nursery phase, depending of which outcome probability is being calculated. The equation estimates mortality and the percentage of LWP for both targeted and nontargeted groups when a specific weaning weight cutoff is applied. Performance estimates for the targeted groups before the treatment effect was deduced are reported in Table 2.
Treatment effect
For Option One, pigs were not treated, and therefore mortality and percentage of LWP were equal to the estimates for the whole population. When all pigs were treated (Option Two), the whole population estimates were adjusted according the treatment effect. When the target treatment was applied (Option Three), mortality and percentage of LWP in the targeted group (Table 2) were adjusted according to the assumed treatment effect (Table 3).
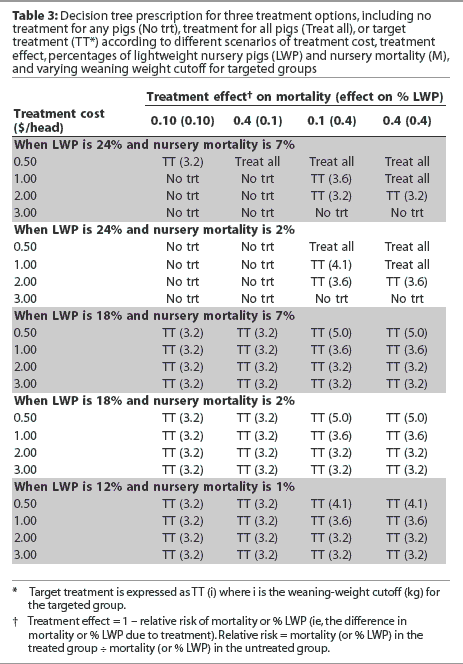
The effect of the hypothetical treatment was modeled using relative risk (RR),16 calculated as the proportion of dead or lightweight pigs in the treated group divided by mortality or LWP in the untreated group. Therefore, the treatment effect (Table 3) was calculated as 1 - RR (ie, when RR = 0.9, then the reduction effect is 0.1). It was assumed that treatment effect is not affected by weaning weight; therefore, the reduction effect was the same for Options Two and Three, except that in Option Two, the values were adjusted when pigs belonged to the targeted group.
Financial outcome and decision tree optimization function
Mortality or LWP at exit from the nursery represent monetary loss, because neither survival nor the desired exit weight is being achieved. When pigs survived and achieved a desired exit weight, losses were set at $0 (Figure 1; all currency in $US). Default values for LWP losses were set at 30%, and mortality losses at 60%, of the feeder pig market price. The feeder pig price used in the analysis was the market average between the years 1974 and 2002 ($40.13 per head).13
The 30% assigned to LWP was calculated by dividing the median nursery exit weight for LWP (12.3 kg) by the median weight for heavyweight pigs (18.2 kg), which represented approximately a 30% (1 - 0.68) difference in final nursery weight.15 Mortality loss was assumed to be the early-weaned pig market price, because mortality was concentrated around weaning time.15 Mortality losses were expressed in the model as 60% of feeder pig price. This value (60%) was inferred from the ratio of early-weaned pig price to feeder pig price, using two sources, the weekly swine marketing report17 and a study describing the relative value of early-weaned pigs and feeder pigs.18
The expected monetary loss (EML) associated with each alternative (Options One, Two, and Three) was calculated as EML = [Sigma] (Pi x Ci), where Pi is the probability of loss and Ci is the financial consequence.14 The decision tree objective was to minimize expected monetary loss due to mortality or LWP (Figure 1).
Sensitivity analysis
Sensitivity analysis was conducted by varying four variables: treatment effect, treatment cost, mortality (%) and LWP (%). A range of values was used to evaluate the potential impact of each parameter. In order to assess the effect of the three options under different nursery performance scenarios, a wide range of potential combinations of mortality and proportion of LWP was used, which are referred to as scenarios of nursery performance.
Production context
The data gathered to construct the decision tree came from a population in which mean weaning age was 16.6 days (SD, 1.6) and mean weaning weight was 3.95 kg (SD, 1.03), and there was a 7-week nursery phase. Pigs from two different sources were commingled upon arrival at the nursery site and sorted into pens by weaning weight and gender. Nurseries were double-curtain barns with 36 pens per barn and approximately 28 pigs per pen. Pens had partially slatted floors and were provided with wet-dry feeders. Pigs were fed ad libitum, with soybean-corn meal offered in four different phases (crude protein 22%, 20%, 18%, and 16%, respectively).
The breeding herds were infected with porcine reproductive and respiratory syndrome (PRRS) virus and Mycoplasma hyopneumoniae. Pigs were vaccinated against M hyopneumoniae at 8 weeks of age. The relationship between weight and performance (survival and LWP status) in individual pigs may have been influenced by disease status for M hyopneu-moniae and PRRS. Nevertheless, the treatment effect was never modeled as greater than 40%, indicating that its hypothetical effect cannot control all causes associated with mortality and LWP. The decision tree was modeled using Precision Tree software (Palisade Corporation, New York, New York).
Results
As weaning weight cutoff increased, more pigs were included in the targeted group (Table 2). However, the relative risk of dying or being lightweight for a given cutoff was always higher among pigs in the targeted group because of the higher rate of cases (deaths or LWP) in the that group compared to the nontargeted group (Table 2). Changes in relative risk according to the weight cutoffs applied reflected the values of Se and Sp of weaning weight predicting dead and lightweight status.
Sensitivity analysis showed that all courses of action may minimize losses (Table 3) and that the best choice is influenced by all parameters included in the sensitivity analysis. The most influential factors in the decisions were treatment effect and the different scenarios of group performance (mortality and the proportion of LWP) (Table 3). The decision was more sensitive to changes in the treatment effect on LWP than the effect on mortality. When treatment effect on LWP was decreased from 40% (0.1 - 0.4) to 10% (0.1 - 0.1), treatment was not feasible (LWP = 24%). The lower financial loss attributed to LWP, compared to mortality, is compensated by the consistently higher proportion of LWP in the population (at least three times higher).
Treating the whole population was the best choice when treatment effect on LWP was approximately 40% and LWP was approximately 24% (Table 3). Conversely, not treating pigs was best when the treatment effect on LWP was 10% (0.1 - 0.1 or 0.4 - 0.1) and the proportion of LWP was approximately 24%, with treatment cost > $1 per head (Table 3).
When nursery mortality was < 7% and the proportion of LWP was < 18%, target treatment using a differential cutoff was the best decision (Table 3). The cutoff used to define the targeted group was sensitive to treatment costs, especially when the treatment effect on LWP was at least 40% (0.1 - 0.4 or 0.4 - 0.4; Table 3). Lower treatment costs allowed higher weaning weight cutoffs (Table 3).
Discussion
Weaning weight was used as a vital piece of information to predict future pigs' performance. As mortality or the percentage of LWP in the targeted group at the end of the nursery period increased, it became more likely that treatment of pigs that were lightweight at weaning would be beneficial. Therefore, targeting the high-risk group would be increasingly effective.
If it were predicted that treatment would reduce both mortality and the proportion of lightweight pigs in at least 40% of the population, treating all or a large segment of the population at weaning (cutoff > 5 kg) would be prescribed, since the benefit of the intervention would outweigh treatment costs, and target intervention would not be recommended.
Target treatment using different cutoffs minimized losses when nursery mortality was < 7% and the proportion of LWP was < 18%. Treatment costs influenced the selection of a particular weaning weight cutoff: the less expensive the intervention, the higher the cutoff that can be applied, because the incremental costs of including in the targeted group pigs that are going to perform well anyway are less penalized.
The decision-tree model was developed using a hypothetical antibiotic treatment, and may be a suitable example for antibiotics administered by injection or in feed or water. Data on treatment effect collected by other means, for instance, by conducting a farm trial or using data from published reports such as meta-analyses (quantitative reviews), may also be used in this model. Estimates derived from single trials conducted under conditions mimicking specific farm conditions may be a valid alternative.
This decision tree is a flexible management tool that can be customized using herd data. It can be used to evaluate the advantages of feeding programs, for example, including milk substitutes or plasma in nursery rations, using herd data for the treatment effect on growth and mortality outcomes. Other possible uses of the decision tree include determining the relationship between weight and performance, definition of "lightweight" at nursery exit (the lower third of the weight distribution at the end of the nursery), the presumed effect of interventions, and losses ascribed to LWP and dead pigs. Weight used to deduce the losses in the model, ie, 30% and 60% of the feeder price for LWP and mortality, respectively, can be estimated using a procurement-cost calculation when feed costs during the nursery phase are available. These percentages can also be subject to sensitivity analysis along with the treatment cost and efficacy values specified in the model. Further expansion of the model can be made if data about the grower-finisher phase are available.
Implications
- In this model, weaning weight was the criterion to decide whether to treat all weaned pigs or just a subgroup, for the purpose of reducing nursery mortality and improving weight gain.
- In this model, higher mortality and higher proportion of pigs with low nursery exit weight in the targeted group would make it more cost- effective to treat the target population than to apply the same treatment to the whole population.
- Using this model, if mortality or proportion of pigs with low nursery exit weight are reduced by at least 40% when treatment is applied, treating all weaned pigs is more cost-effective than target treatment.
References
1. Krahn M, Naglie G, Naimark D, Redelmeier DA, Detsky AS. Primer on medical decision analysis: Part 4 - Analyzing the model and interpreting the results. JAMA. 1997;17:142-151.
*2. Kavanagh S, Lynch PB, Caffrey PJ, Henry WD. The effect of pig weaning weight on post-weaning performance and carcass traits. Proc VI Biennal Conf Australasian Pig Sci Assoc. Attwood, Victoria, Australia. 1997:174-176.
3. Mahan DC. Effect of weight, split-weaning, and nursery feeding programs on performance response of pigs to 105 kilograms body weight and subsequent effects on sow rebreeding interval. J Anim Sci. 1993;71:1991-1995.
*4. Moore C. Using high-health technology in a modern production system. Proc AD Leman Swine Conf. St Paul, Minnesota. 1995:18-25.
5. Dijkhuizen A, Huirne R, Jalcingh A. Economic analysis of animal diseases and their control. Prev Vet Med. 1995;25:135-149.
6. Fetrow J, Madison JB, Galligan D. Economic decision in veterinary practice: A method for field use. JAVMA. 1985;186:792-797.
7. Gardner IA, Hird DW, Franti CE. Financial evaluation of vaccination and testing alternatives for control of parvovirus-induced reproductive failure in swine. JAVMA. 1996;208:863-869.
8. Marsh WE. Decision tree analysis: Drawing some of the uncertainty out of decision making. J Swine Health Prod. 1993;1(4):17-23.
9. Slenning BD, Gardner IA. Economic evaluation of risks to producers who use milk residue testing programs. JAVMA. 1997;211:420-427.
10. Smith RD, Slenning BD. Decision analysis: Dealing with uncertainty in diagnostic testing. Prev Vet Med. 2000;45:139-162.
11. Clemen T, Reilly T. Making Hard Decisions with Decision Tools. 3rd ed. Pacific Grove, California: Duxburry Press. 2001:733.
12. Detsky AS, Naglie G, Krahn MD, Naimark D, Redelmeier DA. Primer on medical decision analysis: Part 1 - Getting started. JAMA. 1997;17:123-141.
13. Livestock Market News, AMS-USDA, Omaha, Nebraska (1972-1991) and Sioux Falls, South Dakota (1998-2002). Available at http://www.agecon.unl.edu/mark/Agprices/Feederpigs.pdf. Accessed December 30, 2004.
14. Mohammed HO, Loefler S, Shearer J. Financial comparison of three testing strategies for detection of estrus in dairy cattle. JAVMA. 1990;196:865-869.
*15. Larriestra A, Wattanaphansak S, Morrison RB, Deen J. Host factors as predictors of mortality and slow growth in nursery pigs. Proc IPVS Cong. Ames, Iowa. 2002:338.
16. Thrusfield M. Veterinary Epidemiology. 2nd ed. Oxford, England: Blackwell Publishing. 1995:479.
17. Market Price comparisons. Available at http://www.extension.iastate.edu/notes/display.aspx?catID=100. Accessed February 13, 2005.
18. Dhuyvetter KC. Estimating the Value of Segregated Early Weaned Pigs. Kansas State University, Cooperative Extension Service. 1996. Publication MF-2221.
* Non-refereed references